> ## Documentation Index
> Fetch the complete documentation index at: https://help.peliqan.io/llms.txt
> Use this file to discover all available pages before exploring further.
# Churn Prediction
> Predict which customers are likely to cancel (churn) in order to proactively take measures to retain them.
Predict which customers are likely to cancel (churn) in order to proactively take measures to retain them. We will train a machine learning (ML) model based on historical customer data (including a column that indicates if the customer churned), in order to predict likelihood of churn for current customer.
Churn prediction is crucial for businesses relying on **recurring revenue**. It identifies **customers likely to stop using a product** or service. The process involves analyzing a large amount of customer data to identify at-risk customers. This can be complex due to the need to **identify patterns and trends**.
Here is an example on how to build an ML model in Peliqan.io with a few lines of Python code.
### Import required modules
```python theme={null}
from sklearn.model_selection import train_test_split
from sklearn.ensemble import RandomForestClassifier
from sklearn.metrics import accuracy_score
from sklearn.preprocessing import LabelEncoder
from collections import defaultdict
from joblib import dump
import pandas as pd
```
### Load a dataset
Load data from a table into a dataframe (df). The table needs to contains customer data, including an indication if these customers churned (historical data).
```python theme={null}
# Load Data
dbconn = pq.dbconnect(pq.DW_NAME)
df = dbconn.fetch(pq.DW_NAME, 'schema_name', 'customers', df = True)
```
Refer to [Peliqan Docs](https://peliqan.io/docs) to explore all available functionality.
### Using Streamlit to build an app
We use the [Streamlit](https://docs.streamlit.io/library/api-reference/text) module (st), built into Peliqan.io, to build a UI and show data.
```python theme={null}
# Show a title (st = Streamlit module)
st.title("Churn Prediction")
# Show some text
st.text("Sample data")
# Show the dataframe
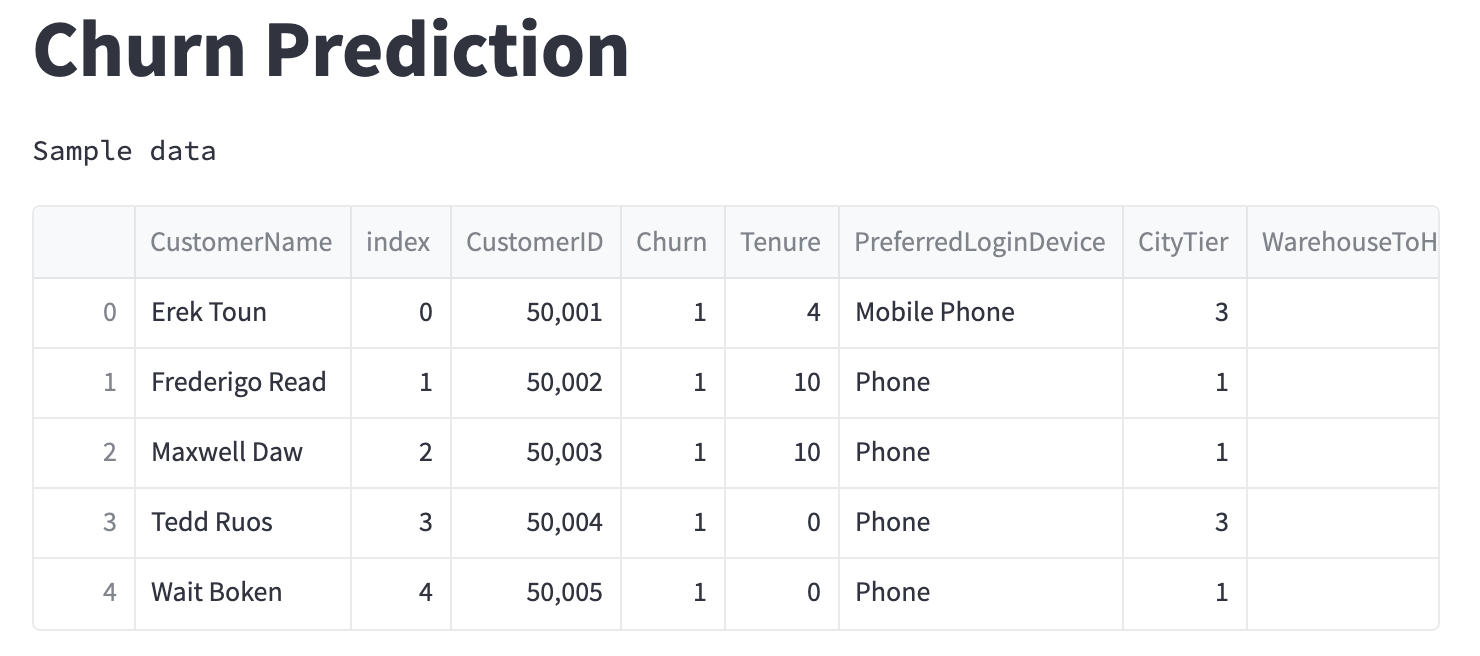
st.dataframe(df.head(), use_container_width=True)
```
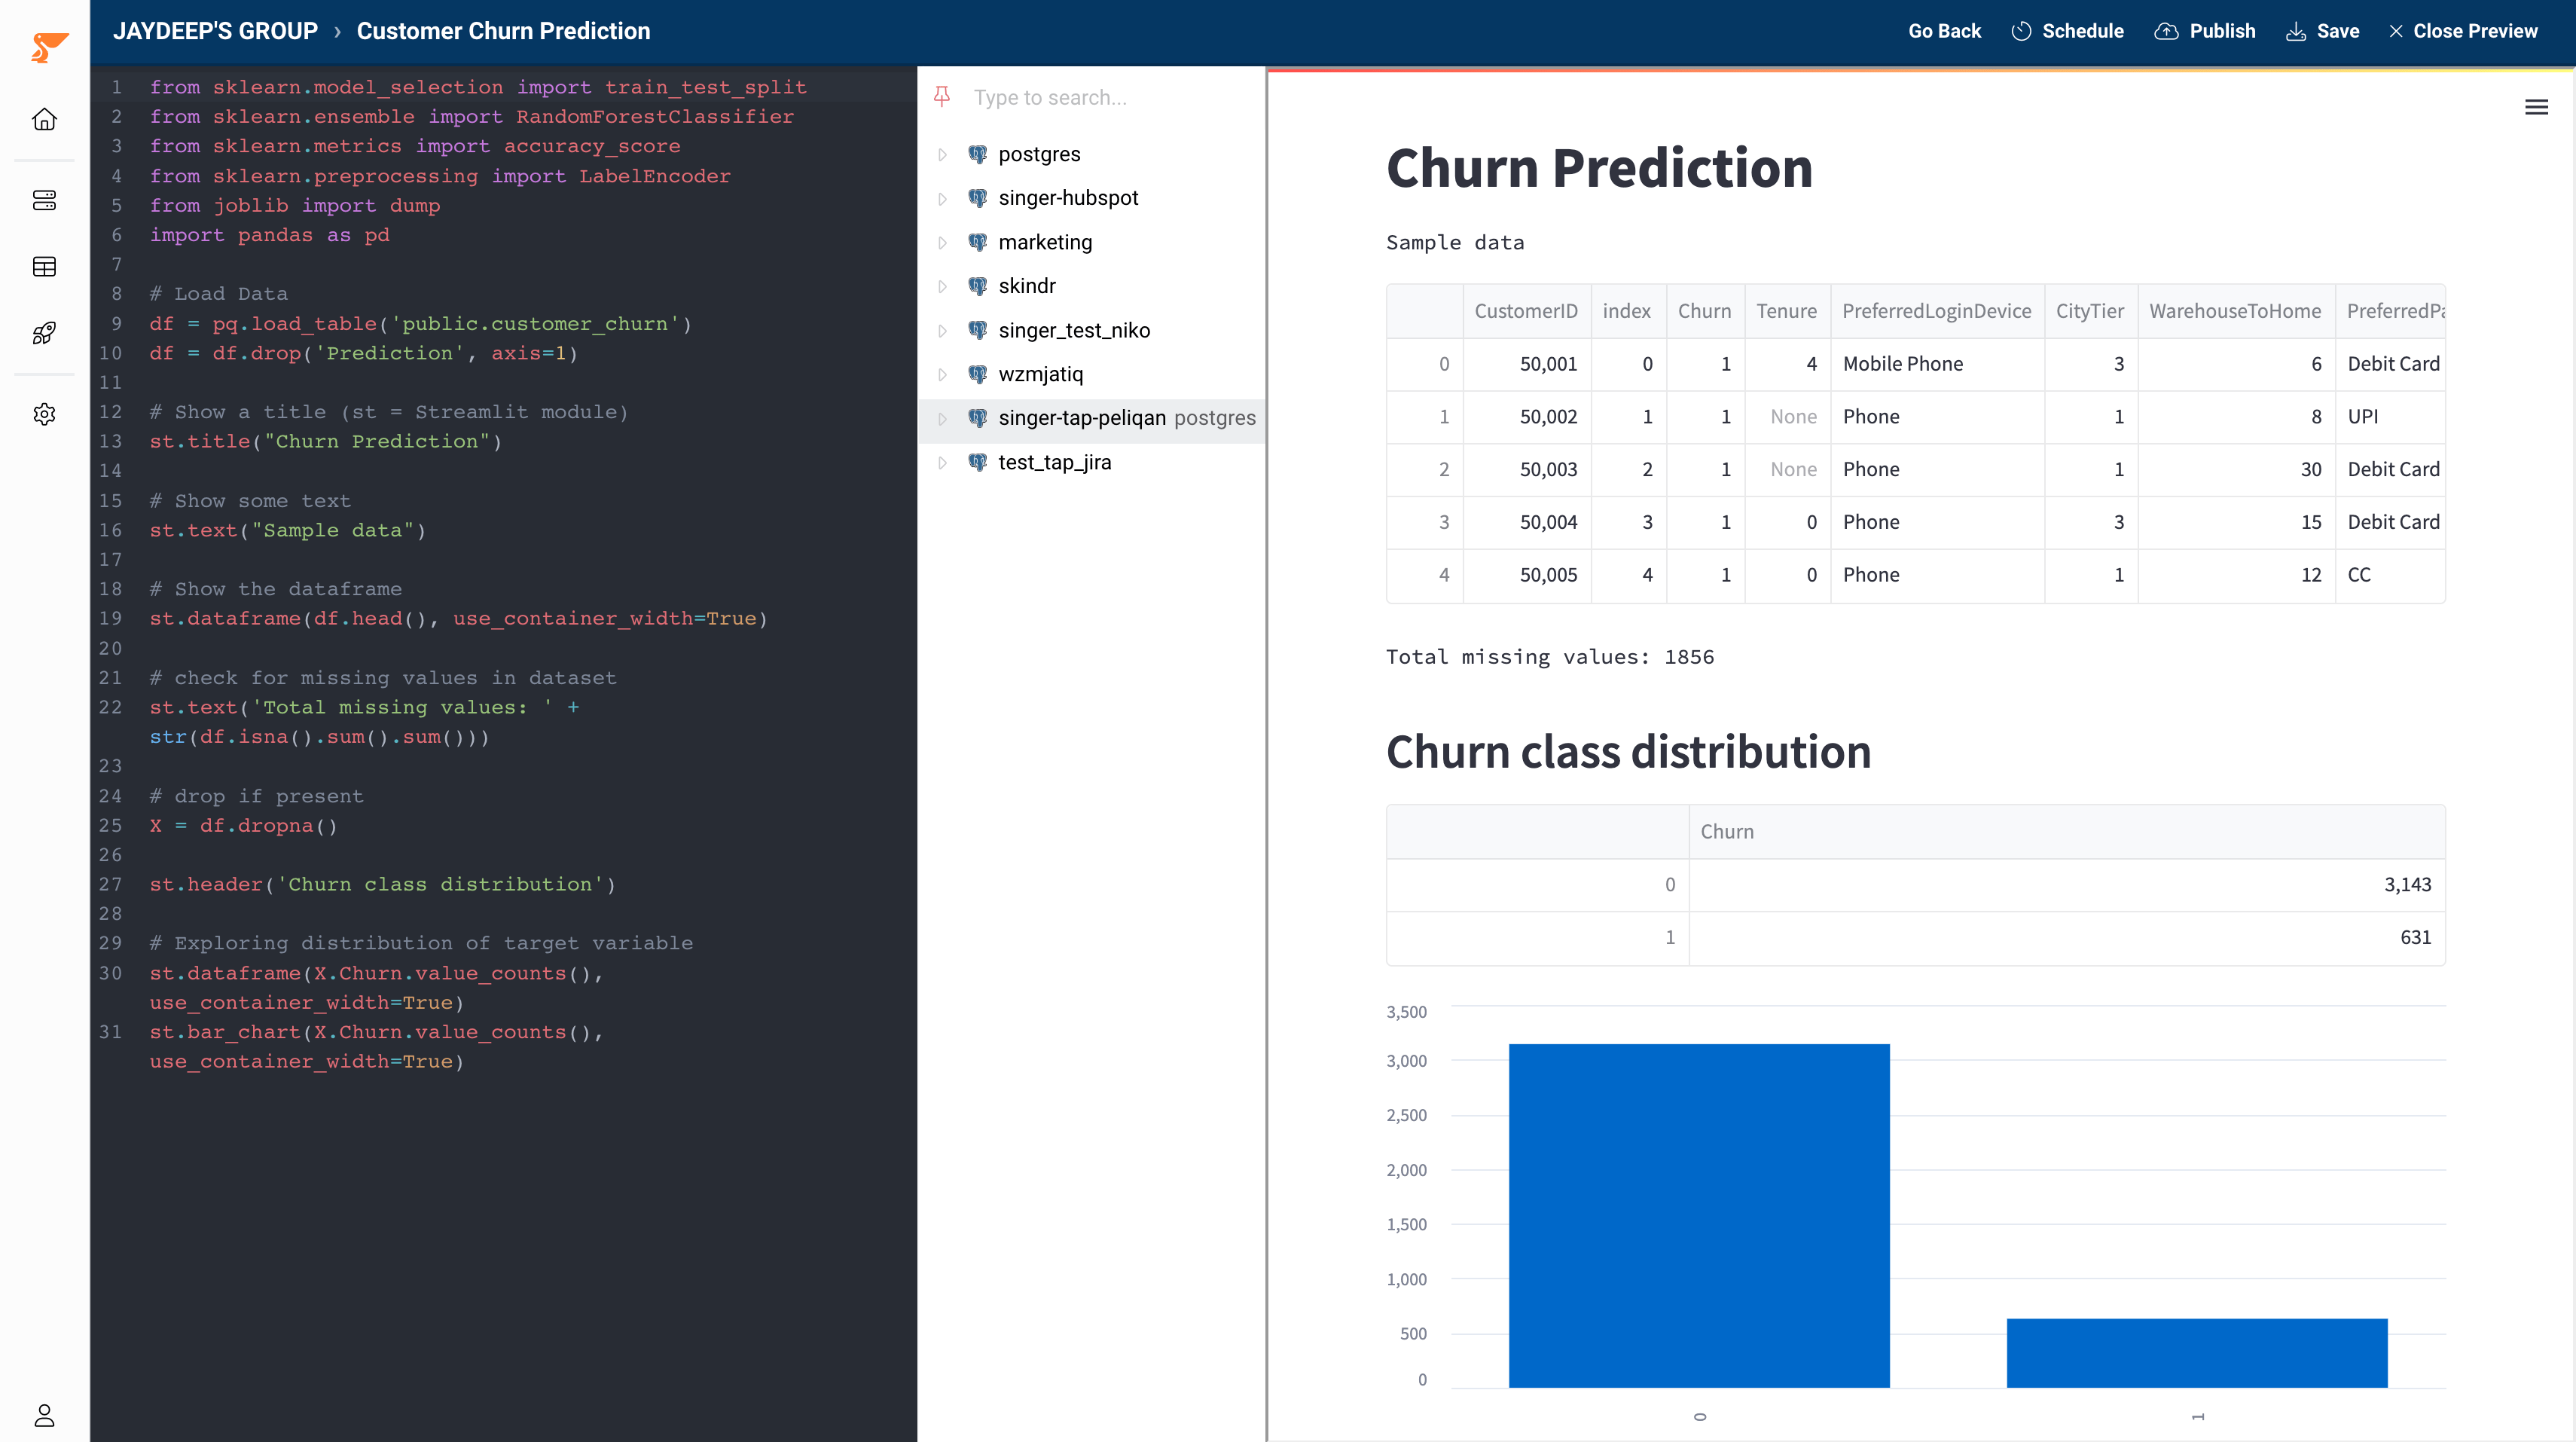
This is what the output looks like:
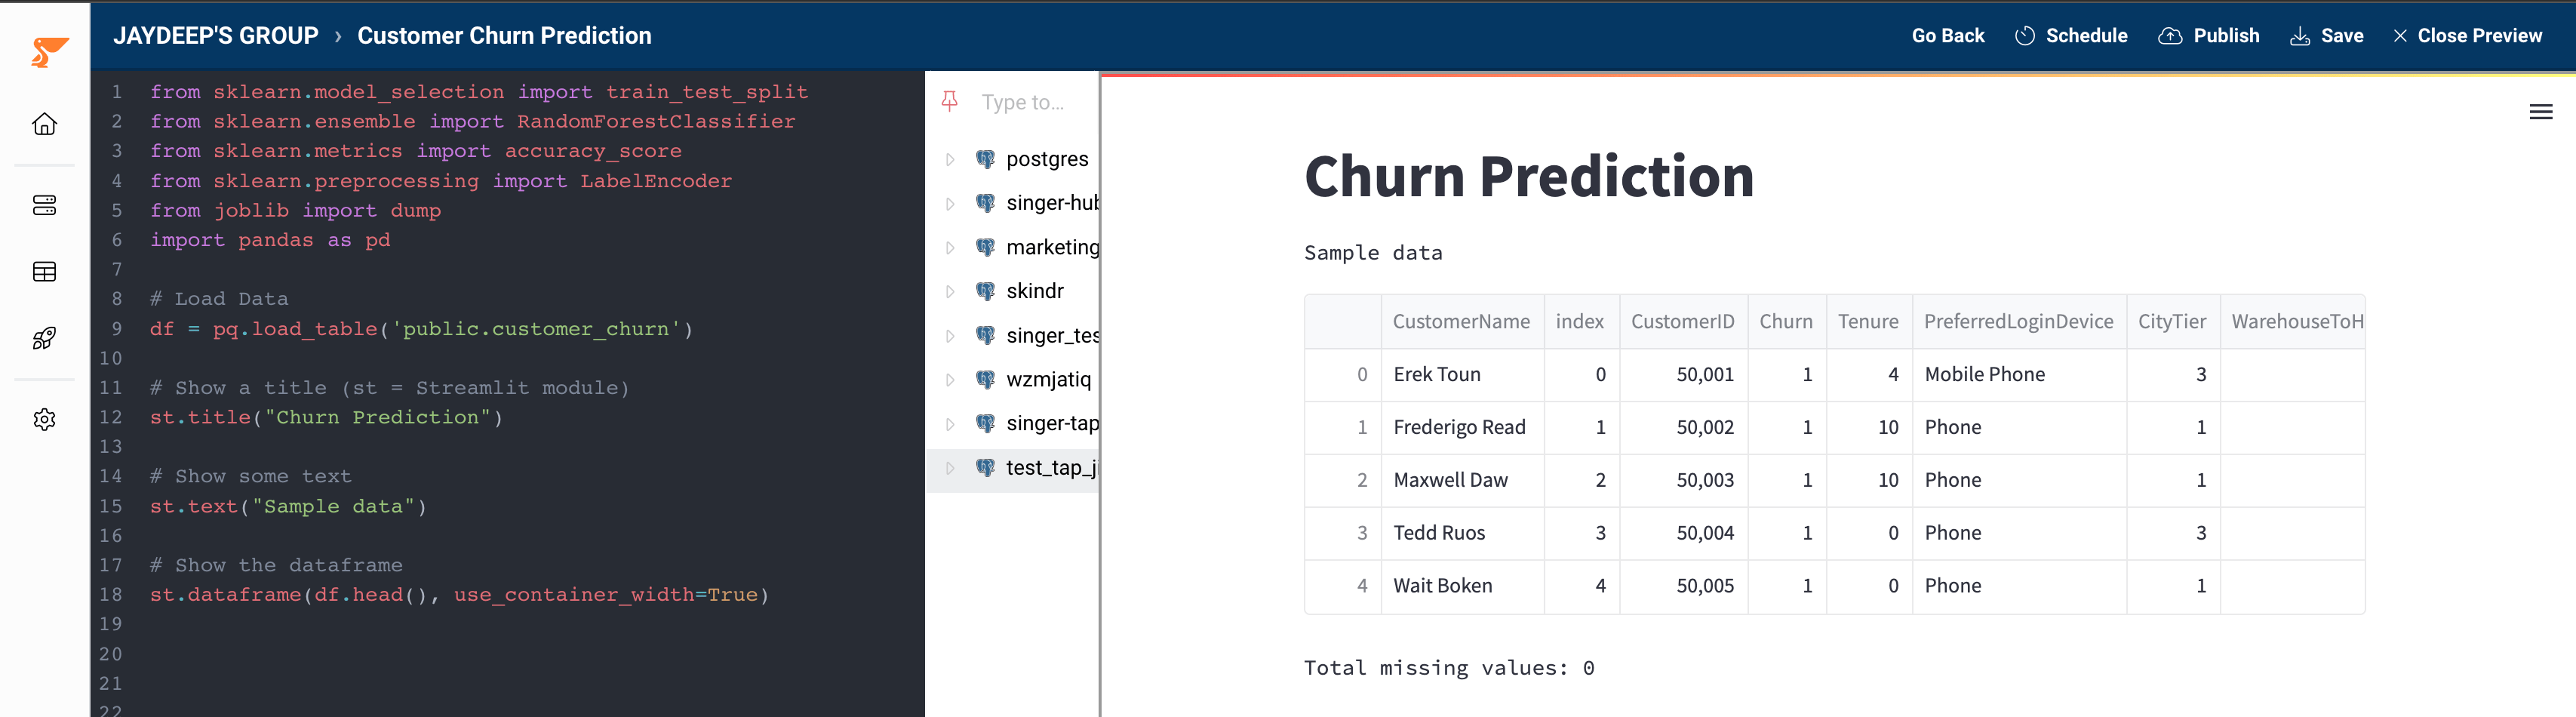
 Here’s our code in the Peliqan low-code editor, with a preview:
 ### Explore and prepare the data
Always look for missing values and try to handle them.
```python theme={null}
# Drop customer name as it is not important for prediction
X = df.drop(['CustomerName', 'Prediction'], axis=1)
# Check for missing values in the dataset
st.text('Total missing values: ' + str(X.isna().sum().sum()))
```
There are **no missing values** in our dataset. If they are present you might want to handle them by **replacing or dropping them**. For more info on how to handle missing values click [here](https://scikit-learn.org/stable/modules/impute.html).
Now we can start by **exploring the distribution** of the **target variable** (churn class in our case) to see if the target variable has a **balanced distribution**.
```python theme={null}
st.header('Churn class distribution')
# Explore the distribution of the target variable
st.dataframe(X.Churn.value_counts(), use_container_width=True)
st.bar_chart(X.Churn.value_counts(), use_container_width=True)
```
### Explore and prepare the data
Always look for missing values and try to handle them.
```python theme={null}
# Drop customer name as it is not important for prediction
X = df.drop(['CustomerName', 'Prediction'], axis=1)
# Check for missing values in the dataset
st.text('Total missing values: ' + str(X.isna().sum().sum()))
```
There are **no missing values** in our dataset. If they are present you might want to handle them by **replacing or dropping them**. For more info on how to handle missing values click [here](https://scikit-learn.org/stable/modules/impute.html).
Now we can start by **exploring the distribution** of the **target variable** (churn class in our case) to see if the target variable has a **balanced distribution**.
```python theme={null}
st.header('Churn class distribution')
# Explore the distribution of the target variable
st.dataframe(X.Churn.value_counts(), use_container_width=True)
st.bar_chart(X.Churn.value_counts(), use_container_width=True)
```
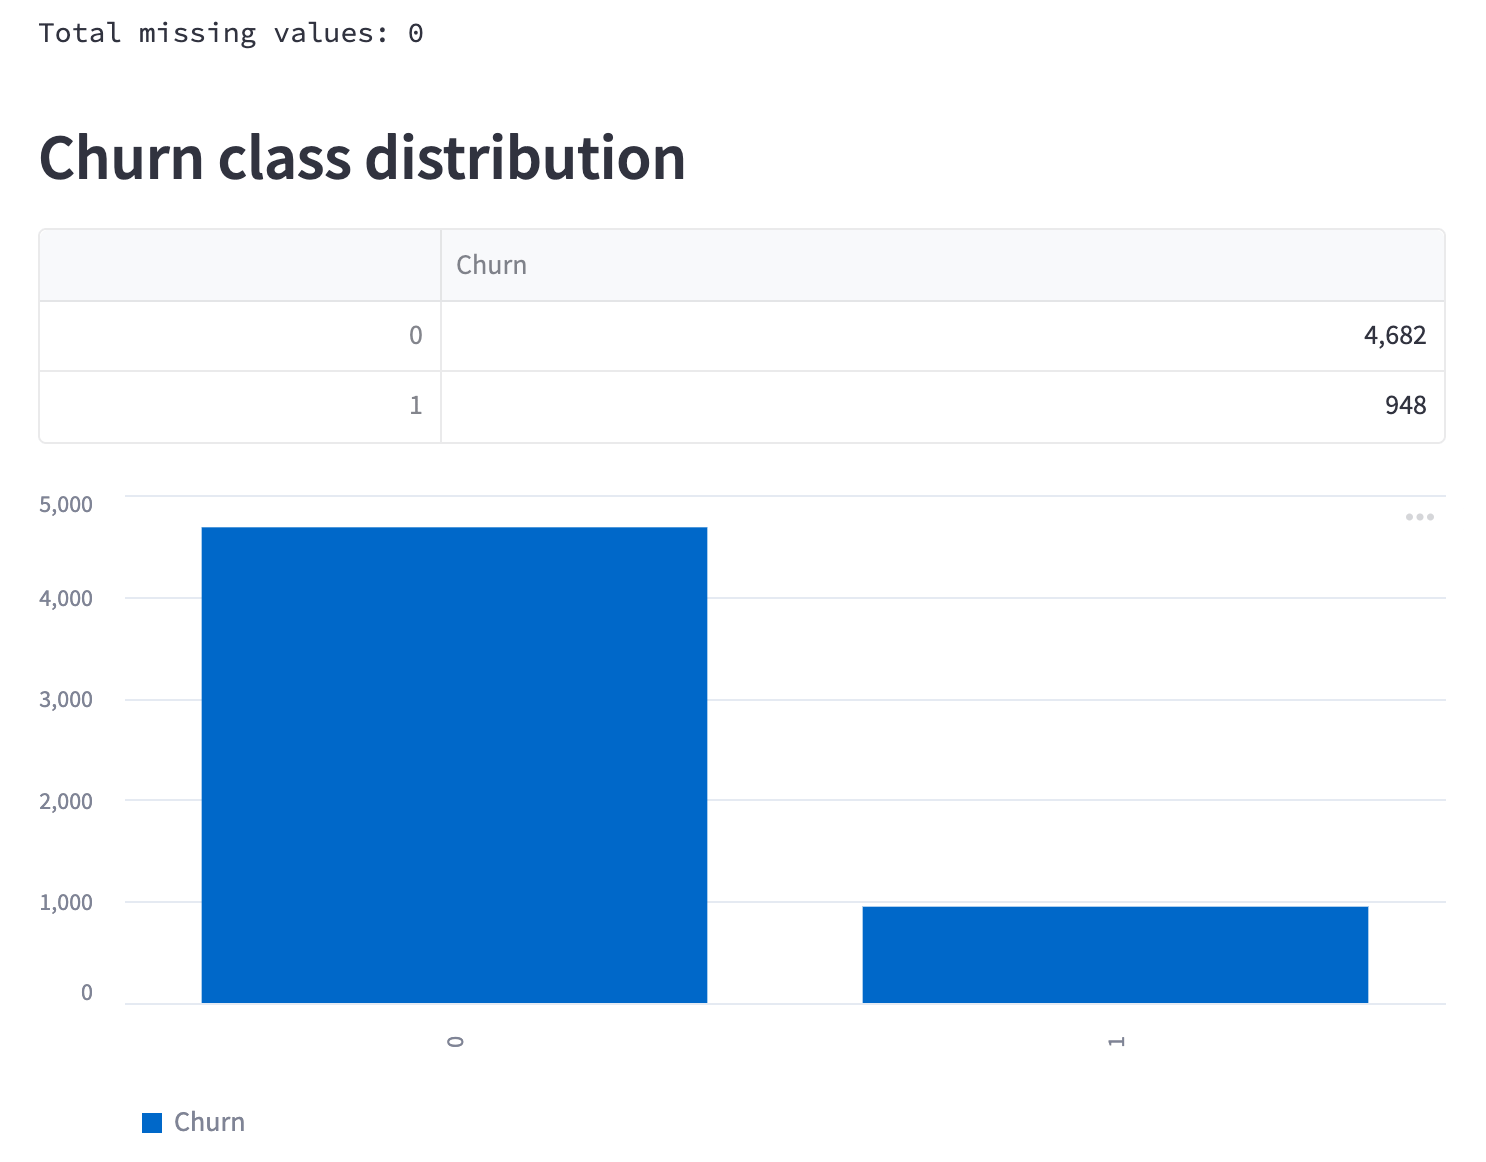 The target variable has an **imbalanced class distribution**. The positive class (Churn=Yes) is much smaller than the negative class (churn=No). An imbalanced class distributions influence the performance of a machine learning model negatively. We will use upsampling or downsampling to overcome this issue.
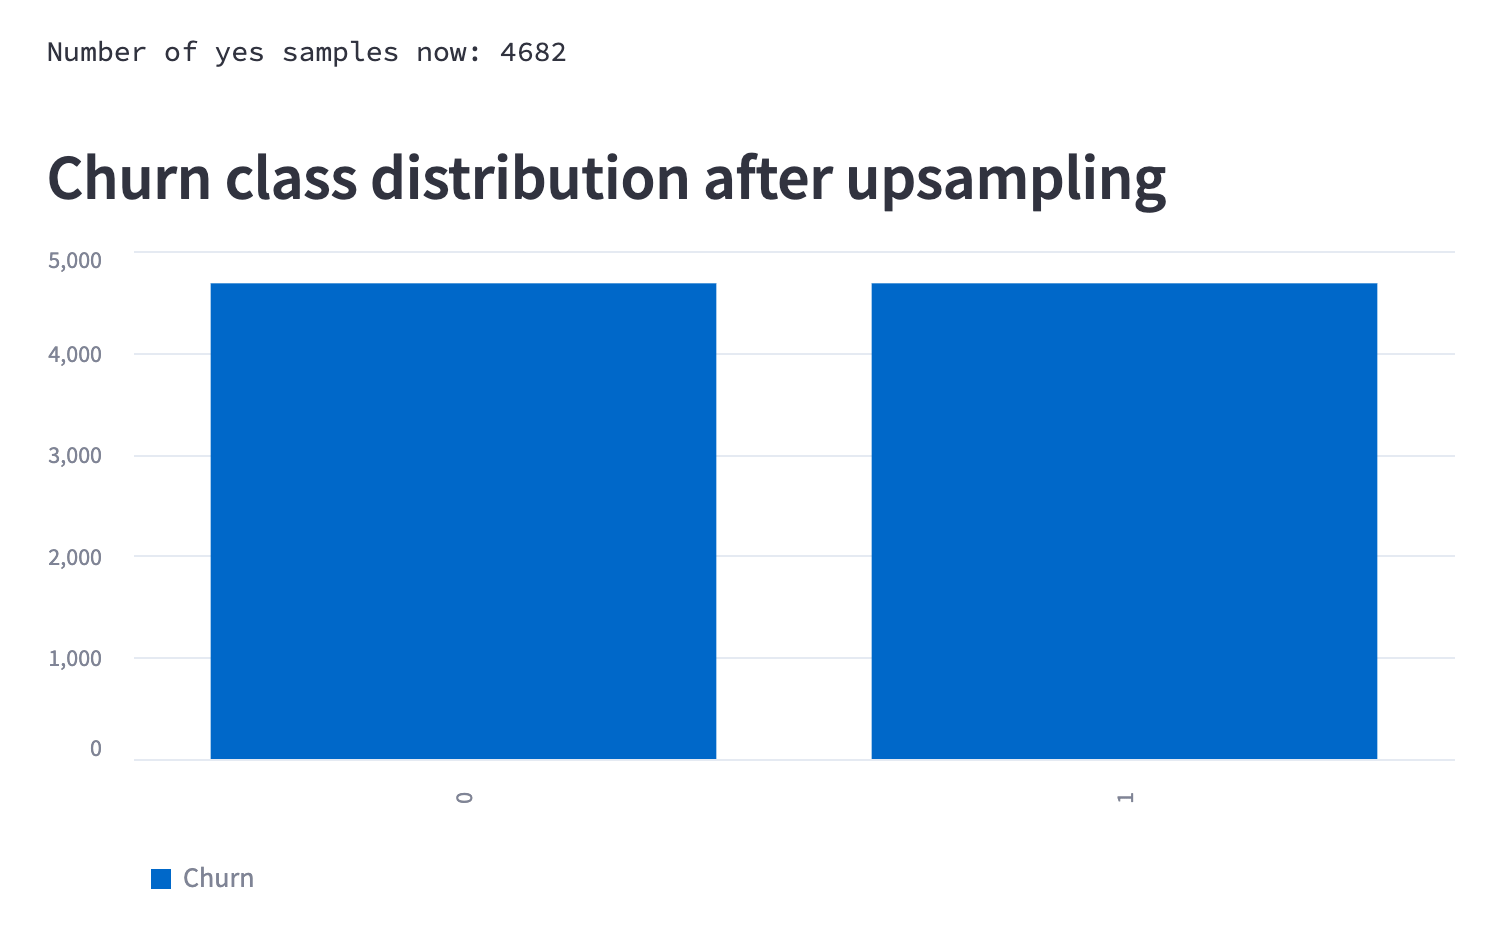
First we'll **convert categorical data into numerical data** so that the ML model can understand it and we'll do **upsampling to handle an unbalanced dataset**.
```python theme={null}
encoder = defaultdict(LabelEncoder)
# Apply Label Encoding to convert categorical variables to Numerical
cat_cols = X.select_dtypes('object').columns
X[cat_cols] = X[cat_cols].apply(lambda x: encoder[x.name].fit_transform(x))
dump(encoder, '/data_app/encoder_churn_prediction') # saving churn label encoder for prediction use
# Resampling
# Separate positive class (churn=yes) and negative class (churn=no)
X_no = X[X.Churn == 0]
X_yes = X[X.Churn == 1]
# Upsample the positive class
X_yes_upsampled = X_yes.sample(n=len(X_no), replace=True, random_state=42)
st.text('Number of yes samples now: ' + str(len(X_yes_upsampled)))
st.header('Churn class distribution after upsampling')
# Combine it with Churn=no and lets again visualize the distribution
X_upsampled = X_no.append(X_yes_upsampled).reset_index(drop=True)
st.bar_chart(X_upsampled.Churn.value_counts(), use_container_width=True)
```
To learn more about upsampling click [here](https://www.analyticsvidhya.com/blog/2022/05/handling-imbalanced-data-with-imbalance-learn-in-python/).
The target variable has an **imbalanced class distribution**. The positive class (Churn=Yes) is much smaller than the negative class (churn=No). An imbalanced class distributions influence the performance of a machine learning model negatively. We will use upsampling or downsampling to overcome this issue.
First we'll **convert categorical data into numerical data** so that the ML model can understand it and we'll do **upsampling to handle an unbalanced dataset**.
```python theme={null}
encoder = defaultdict(LabelEncoder)
# Apply Label Encoding to convert categorical variables to Numerical
cat_cols = X.select_dtypes('object').columns
X[cat_cols] = X[cat_cols].apply(lambda x: encoder[x.name].fit_transform(x))
dump(encoder, '/data_app/encoder_churn_prediction') # saving churn label encoder for prediction use
# Resampling
# Separate positive class (churn=yes) and negative class (churn=no)
X_no = X[X.Churn == 0]
X_yes = X[X.Churn == 1]
# Upsample the positive class
X_yes_upsampled = X_yes.sample(n=len(X_no), replace=True, random_state=42)
st.text('Number of yes samples now: ' + str(len(X_yes_upsampled)))
st.header('Churn class distribution after upsampling')
# Combine it with Churn=no and lets again visualize the distribution
X_upsampled = X_no.append(X_yes_upsampled).reset_index(drop=True)
st.bar_chart(X_upsampled.Churn.value_counts(), use_container_width=True)
```
To learn more about upsampling click [here](https://www.analyticsvidhya.com/blog/2022/05/handling-imbalanced-data-with-imbalance-learn-in-python/).
 ### Model Training & Evaluation
We will use Random Forest Classifier to do the prediction. To learn more visit [SKlearn](https://scikit-learn.org/stable/modules/generated/sklearn.ensemble.RandomForestClassifier.html).
```python theme={null}
X = X_upsampled.drop(['Churned'], axis=1) #features (independent variables)
Y = X_upsampled['Churned'] #target (dependent variable)
# Split the dataset into a Train and Test set
X_train, X_test, Y_train, Y_test = train_test_split(X, Y, test_size = 0.2, random_state=42)
# Train the model using the Training set
model = RandomForestClassifier(n_estimators=50, max_depth=3) # define the model
model.fit(X_train, Y_train)
# Predict using the Test set
pred_test = model.predict(X_test)
st.text('Accuracy on testing set: ' + str(accuracy_score(Y_test, pred_test)))
# Saving the model for real time predictions
dump(model, '/data_app/model_churn_prediction')
st.success('Model saved successfully')
```
To learn more about evaluating your models visit [SKlearn](https://scikit-learn.org/stable/modules/model_evaluation.html).
You can use any [classification algorithm](https://scikit-learn.org/stable/supervised_learning.html) to solve similar problems.
Expand this to see the full code
```python theme={null}
from sklearn.model_selection import train_test_split
from sklearn.ensemble import RandomForestClassifier
from sklearn.metrics import accuracy_score
from sklearn.preprocessing import LabelEncoder
from collections import defaultdict
from joblib import dump
import pandas as pd
# Load Data
dbconn = pq.dbconnect('dw_123')
df = dbconn.fetch('db_name', 'schema_name', 'customers', df = True)
# Show a title (st = Streamlit module)
st.title("Churn Prediction")
# Show some text
st.text("Sample data")
# Show the dataframe
st.dataframe(df.head(), use_container_width=True)
# Drop customer name as it is not important for prediction
X = df.drop(['CustomerName', 'Prediction'], axis=1)
# Check for missing values in the dataset
st.text('Total missing values: ' + str(X.isna().sum().sum()))
st.header('Churn class distribution')
# Explore the distribution of the target variable
st.dataframe(X.Churn.value_counts(), use_container_width=True)
st.bar_chart(X.Churn.value_counts(), use_container_width=True)
encoder = defaultdict(LabelEncoder)
# Apply Label Encoding to convert categorical variables to Numerical
cat_cols = X.select_dtypes('object').columns
X[cat_cols] = X[cat_cols].apply(lambda x: encoder[x.name].fit_transform(x))
dump(encoder, '/data_app/encoder_churn_prediction') # saving churn label encoder for prediction use
# Resampling
# Separate positive class (churn=yes) and negative class (churn=no)
X_no = X[X.Churn == 0]
X_yes = X[X.Churn == 1]
# Upsample the positive class
X_yes_upsampled = X_yes.sample(n=len(X_no), replace=True, random_state=42)
st.text('Number of yes samples now: ' + str(len(X_yes_upsampled)))
st.header('Churn class distribution after upsampling')
# Combine it with Churn=no and visualize the distribution
X_upsampled = X_no.append(X_yes_upsampled).reset_index(drop=True)
st.bar_chart(X_upsampled.Churn.value_counts(), use_container_width=True)
X = X_upsampled.drop(['Churned'], axis=1) #features (independent variables)
y = X_upsampled['Churned'] #target (dependent variable)
# Split the dataset into a Train and Test set
X_train, X_test, y_train, y_test = train_test_split(X, y, test_size = 0.2, random_state=42)
# Train the model using the Training set
model = RandomForestClassifier(n_estimators=50, max_depth=3) # define the model
model.fit(X_train, y_train)
# Predict on the Test set
pred_test = model.predict(X_test)
st.text('Accuracy on testing set: ' + str(accuracy_score(y_test, pred_test)))
# Save the model for real time predictions
dump(model, '/data_app/model_churn_prediction')
st.success('Model saved successfully')
```
### Model Training & Evaluation
We will use Random Forest Classifier to do the prediction. To learn more visit [SKlearn](https://scikit-learn.org/stable/modules/generated/sklearn.ensemble.RandomForestClassifier.html).
```python theme={null}
X = X_upsampled.drop(['Churned'], axis=1) #features (independent variables)
Y = X_upsampled['Churned'] #target (dependent variable)
# Split the dataset into a Train and Test set
X_train, X_test, Y_train, Y_test = train_test_split(X, Y, test_size = 0.2, random_state=42)
# Train the model using the Training set
model = RandomForestClassifier(n_estimators=50, max_depth=3) # define the model
model.fit(X_train, Y_train)
# Predict using the Test set
pred_test = model.predict(X_test)
st.text('Accuracy on testing set: ' + str(accuracy_score(Y_test, pred_test)))
# Saving the model for real time predictions
dump(model, '/data_app/model_churn_prediction')
st.success('Model saved successfully')
```
To learn more about evaluating your models visit [SKlearn](https://scikit-learn.org/stable/modules/model_evaluation.html).
You can use any [classification algorithm](https://scikit-learn.org/stable/supervised_learning.html) to solve similar problems.
Expand this to see the full code
```python theme={null}
from sklearn.model_selection import train_test_split
from sklearn.ensemble import RandomForestClassifier
from sklearn.metrics import accuracy_score
from sklearn.preprocessing import LabelEncoder
from collections import defaultdict
from joblib import dump
import pandas as pd
# Load Data
dbconn = pq.dbconnect('dw_123')
df = dbconn.fetch('db_name', 'schema_name', 'customers', df = True)
# Show a title (st = Streamlit module)
st.title("Churn Prediction")
# Show some text
st.text("Sample data")
# Show the dataframe
st.dataframe(df.head(), use_container_width=True)
# Drop customer name as it is not important for prediction
X = df.drop(['CustomerName', 'Prediction'], axis=1)
# Check for missing values in the dataset
st.text('Total missing values: ' + str(X.isna().sum().sum()))
st.header('Churn class distribution')
# Explore the distribution of the target variable
st.dataframe(X.Churn.value_counts(), use_container_width=True)
st.bar_chart(X.Churn.value_counts(), use_container_width=True)
encoder = defaultdict(LabelEncoder)
# Apply Label Encoding to convert categorical variables to Numerical
cat_cols = X.select_dtypes('object').columns
X[cat_cols] = X[cat_cols].apply(lambda x: encoder[x.name].fit_transform(x))
dump(encoder, '/data_app/encoder_churn_prediction') # saving churn label encoder for prediction use
# Resampling
# Separate positive class (churn=yes) and negative class (churn=no)
X_no = X[X.Churn == 0]
X_yes = X[X.Churn == 1]
# Upsample the positive class
X_yes_upsampled = X_yes.sample(n=len(X_no), replace=True, random_state=42)
st.text('Number of yes samples now: ' + str(len(X_yes_upsampled)))
st.header('Churn class distribution after upsampling')
# Combine it with Churn=no and visualize the distribution
X_upsampled = X_no.append(X_yes_upsampled).reset_index(drop=True)
st.bar_chart(X_upsampled.Churn.value_counts(), use_container_width=True)
X = X_upsampled.drop(['Churned'], axis=1) #features (independent variables)
y = X_upsampled['Churned'] #target (dependent variable)
# Split the dataset into a Train and Test set
X_train, X_test, y_train, y_test = train_test_split(X, y, test_size = 0.2, random_state=42)
# Train the model using the Training set
model = RandomForestClassifier(n_estimators=50, max_depth=3) # define the model
model.fit(X_train, y_train)
# Predict on the Test set
pred_test = model.predict(X_test)
st.text('Accuracy on testing set: ' + str(accuracy_score(y_test, pred_test)))
# Save the model for real time predictions
dump(model, '/data_app/model_churn_prediction')
st.success('Model saved successfully')
```
 ## Next Steps
1. Using **Peliqan** you can **create an app for business users to consume** the model you have made in a **simple and intuitive UI**. Learn more about [creating apps for users to consume your ML model](/low-code-python-data-apps/predictions-machine-learning-templates/create-an-app-for-business-users-to-get-predictions)**.**
2. You can make **predictions on real-time incoming data** using the saved model. Learn more about [making real-time predictions on new incoming data.](/low-code-python-data-apps/predictions-machine-learning-templates/write-predictions-to-a-table)
3. You can make real-time predictions on new incoming data and send [**alerts to slack**](/low-code-python-data-apps/predictions-machine-learning-templates/send-alerts-to-slack) if the model makes a prediction **above a certain threshold**.
This documentation is built and hosted on [Mintlify](https://mintlify.com), a developer documentation platform.
## Next Steps
1. Using **Peliqan** you can **create an app for business users to consume** the model you have made in a **simple and intuitive UI**. Learn more about [creating apps for users to consume your ML model](/low-code-python-data-apps/predictions-machine-learning-templates/create-an-app-for-business-users-to-get-predictions)**.**
2. You can make **predictions on real-time incoming data** using the saved model. Learn more about [making real-time predictions on new incoming data.](/low-code-python-data-apps/predictions-machine-learning-templates/write-predictions-to-a-table)
3. You can make real-time predictions on new incoming data and send [**alerts to slack**](/low-code-python-data-apps/predictions-machine-learning-templates/send-alerts-to-slack) if the model makes a prediction **above a certain threshold**.
This documentation is built and hosted on [Mintlify](https://mintlify.com), a developer documentation platform.